Analytics
Learn more about the basic assignment analytics and the more detailed assignment analytics dashboard.
Analytics provide insights into how students are progressing, as well as an overview of the work that needs to be done by the teaching staff.
Assignment analytics menu
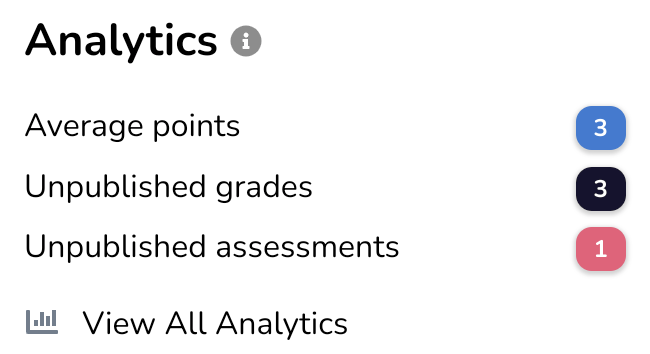
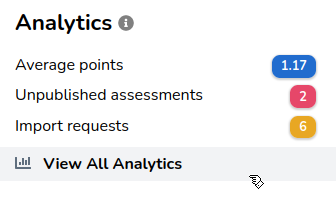
The assignment page holds an Analytics menu which provides some high level insights into the assignment.
- Needs marking: shows the number of entries which have yet to receive an assessment;
- Unpublished grades: shows the number of grades which are yet to be published;
- Unpublished assessments: shows the number of assessments which are yet to be published;
- Average points: shows the average progression within the assignment;
- Import requests: shows the number of unprocessed journal import requests awaiting processing.
Most of these insights relate to specific to-dos and just provide a basic overview of how students are progressing within the assignment.
Navigate to the assignment analytics dashboard via the View All Analytics button to get a more complete picture.
Analytics dashboard
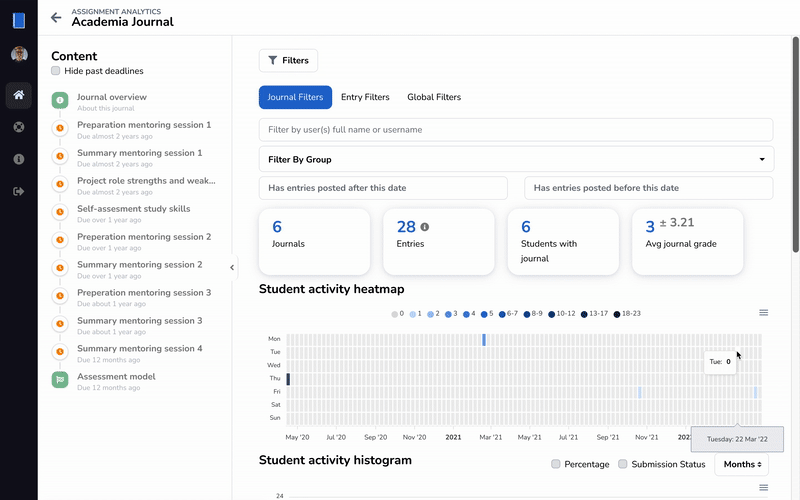
The analytics dashboard consists of three sections: an overview with filters, a timeline, and various graphs.
Overview & filters
By default the overview menu shows some global statistics such as the total number of Journals, Entries, and Students in the assignment.
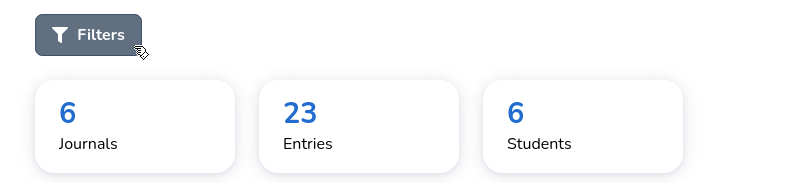
You can expand the filter menu via the Filters button.
Three different levels of filters are available: global, journal, and entry. Each level holds to its own set of filters and statistics.
Journal filters
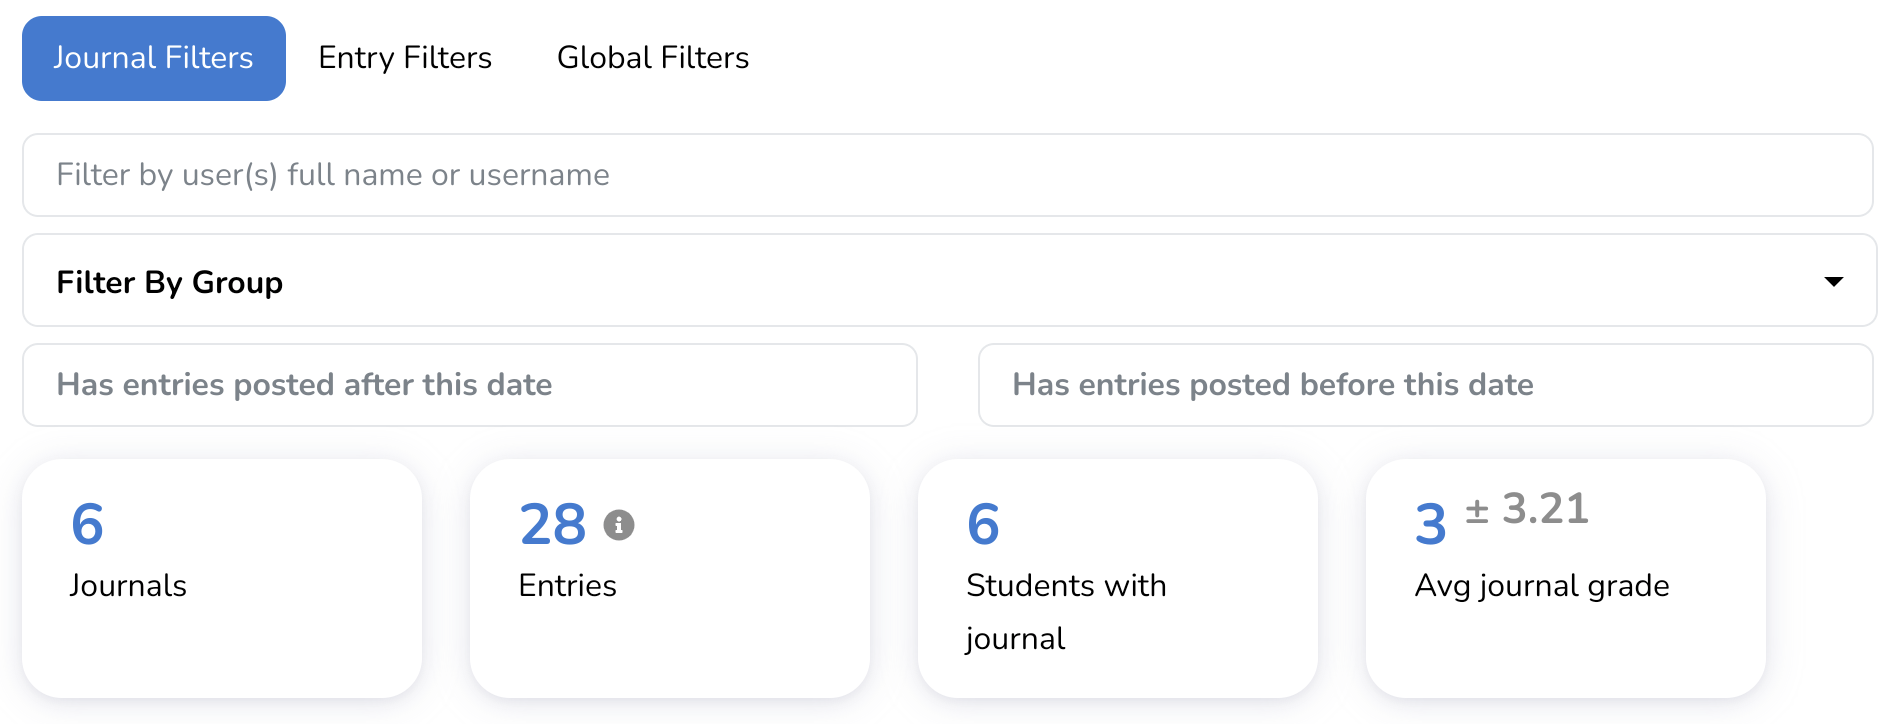
Journal filters apply to the journal as a whole.
So for example take the filter 'Has entries posted after this date'. This checks if the journal holds one or more entries after the given date. If this is the case, the journal and all its entries will be part of any following statistics and graphs.
Entry filters
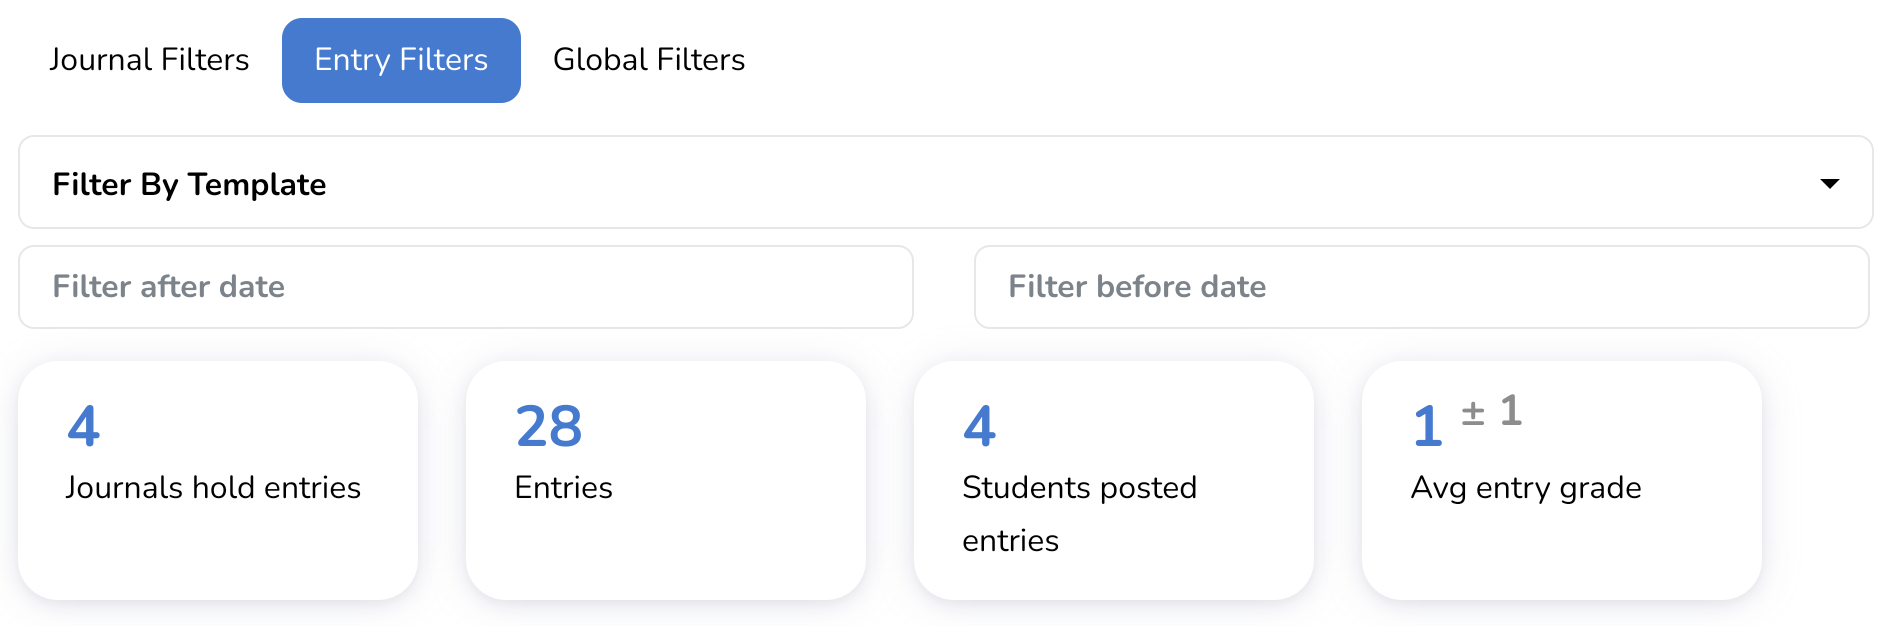
Entry filters apply to individual entries and can be combined with journal filters.
Lets use the following scenario. We want to look at a group of students and only see the entries of a certain category. To accomplish this we can combine the following filters:
First, in the 'Journal Filters' tab use the filter 'Filter By Group' to select the desired group. Now in the 'Entry Filters' tab we can use the filter 'Filter By Category' to select the desired category.
Global filters
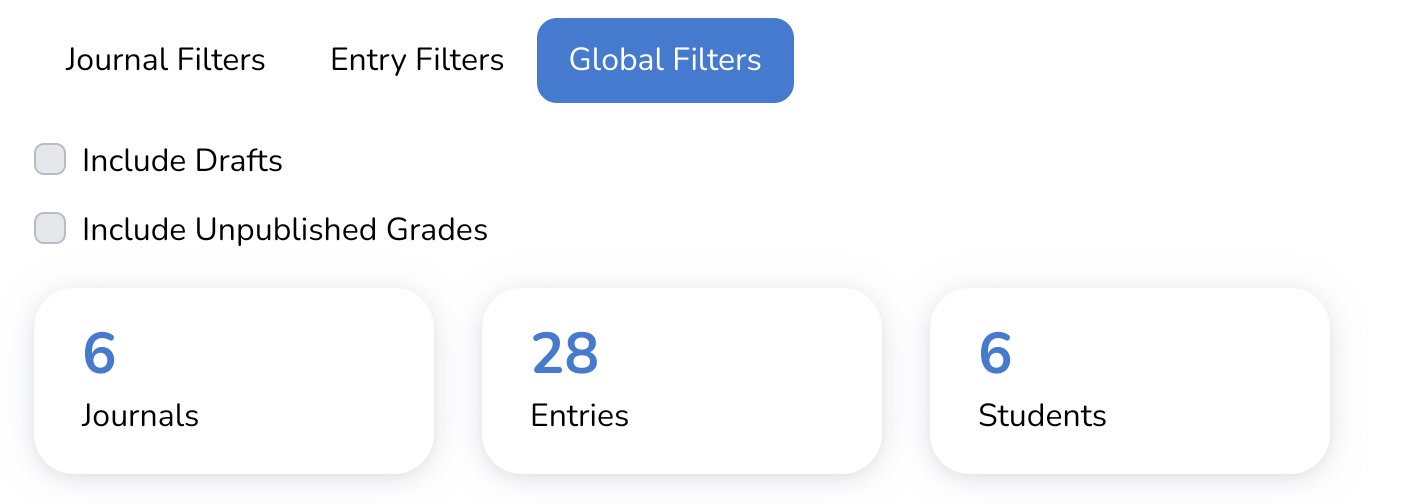
Global filters always apply.
For example the filter 'Include Drafts' will include drafts in relevant filters from both the 'Journal Filters' and 'Entry Filters' tab.
Timeline
The analytics panel makes use of a timeline to select entry deadlines. When you select a deadline, an additional graph displaying the entry submission statuses for that deadline will be become visible.
Only one deadline can be selected at time, but the selected deadline can be combined with all filters.

The timeline is similar to the one used to navigate journals. However, within the analytics panel it is not possible to select activities other than entry deadlines.
Graphs
Student activity heatmap
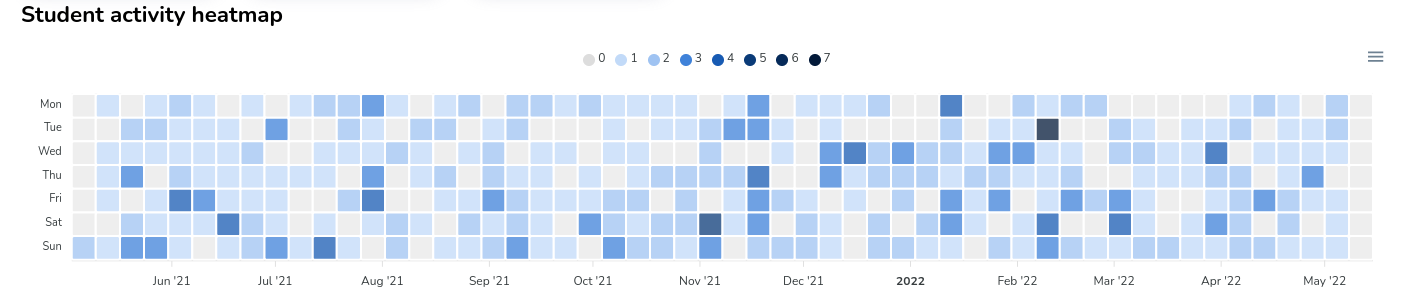
The student activity heatmap visualizes how many entries are posted (and/or drafted) on a given day of the week. Each block represents a specific day, and can be hovered to read the exact amount of entries and the exact date.
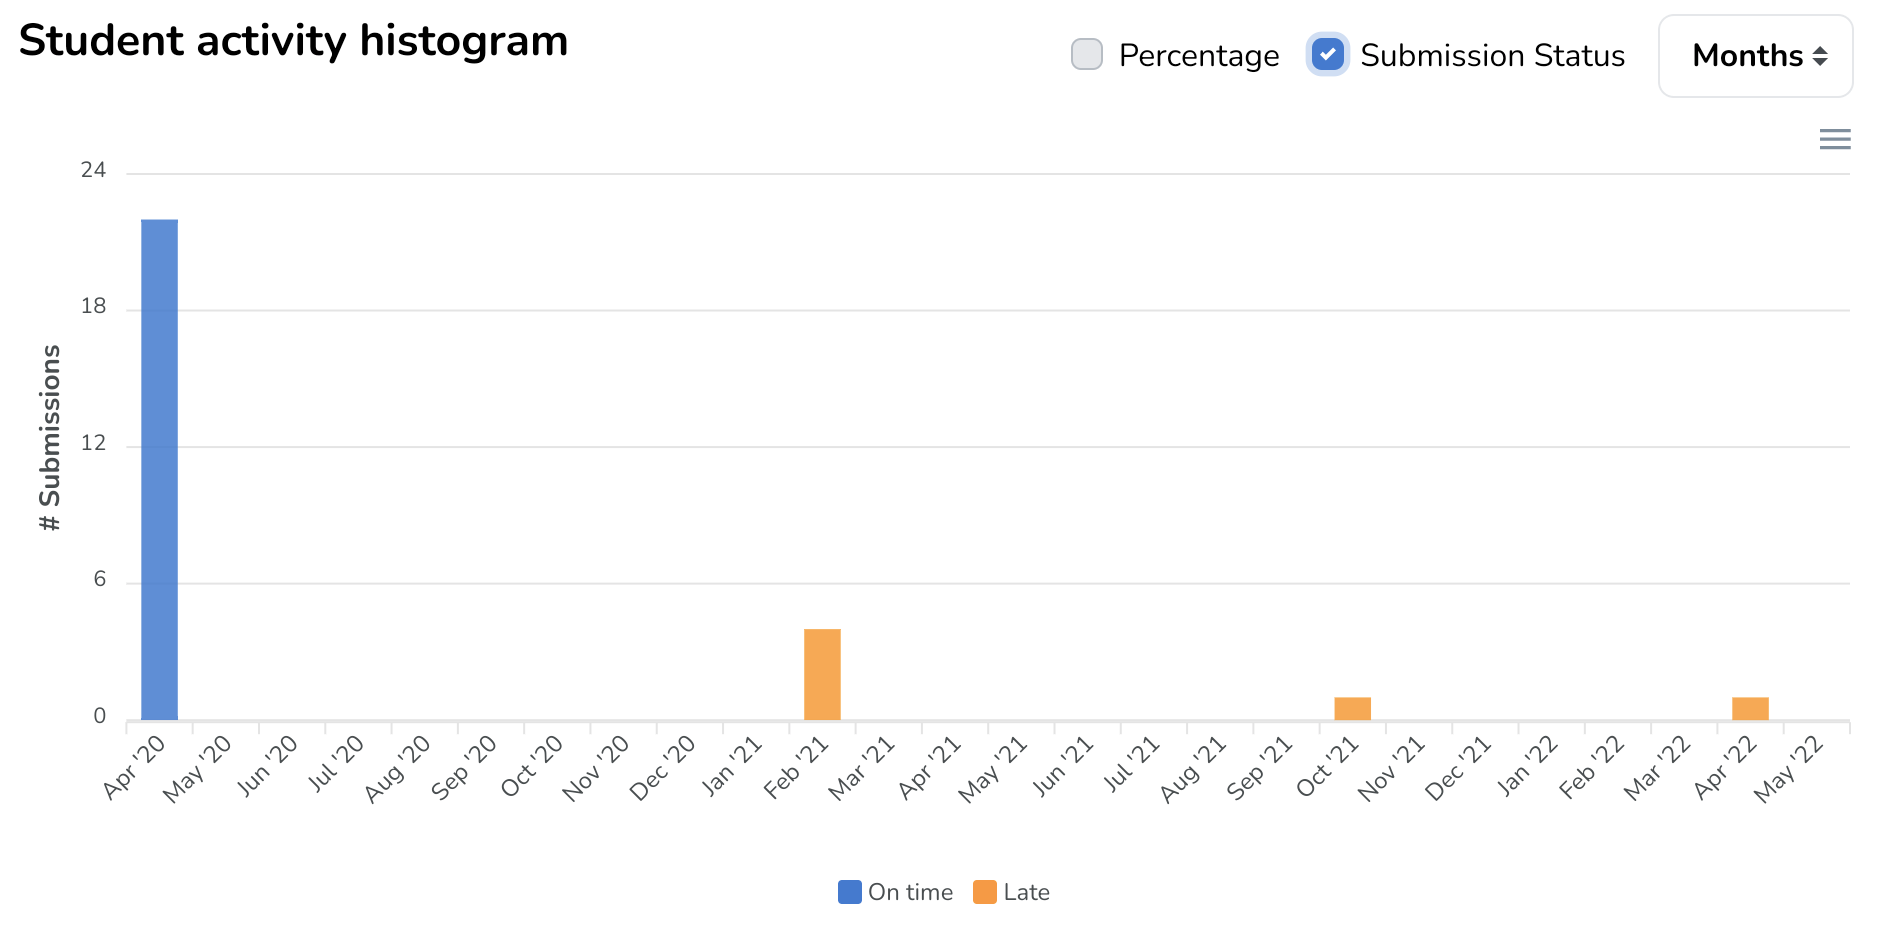
Student activity histogram
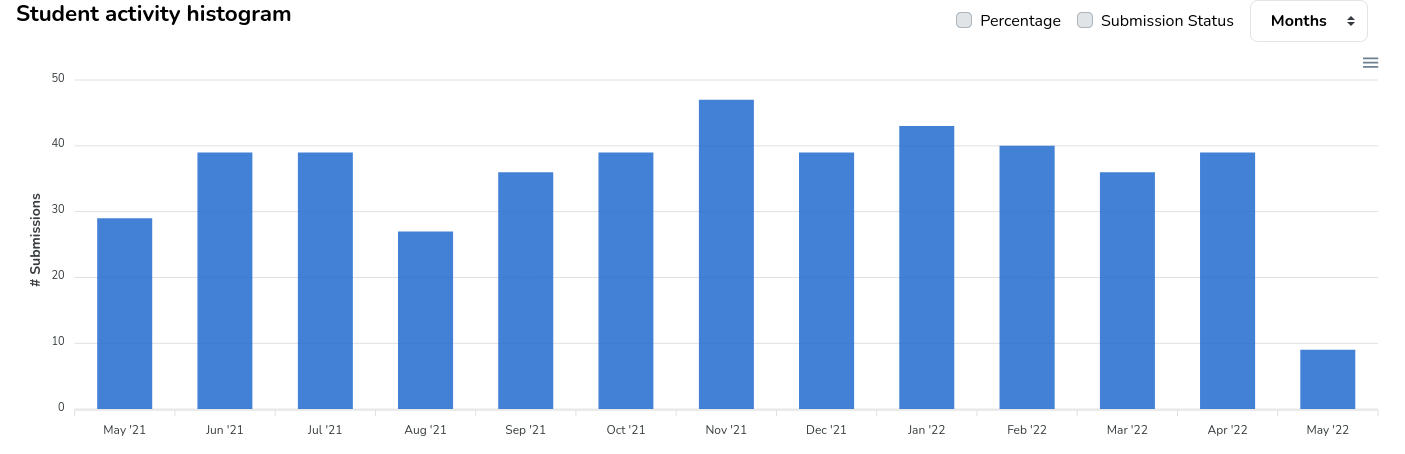
The student activity histogram visualizes how many entries are posted within a given date range. You can change the date range at the top right of the graph.
It is possible to include the submission status (whether the entry was submitted before or after an applicable due date) in the graph. With the global filter 'Include Drafts' activated, drafts are also visualized.
A deadline's due and lock date are also visualized
Grades
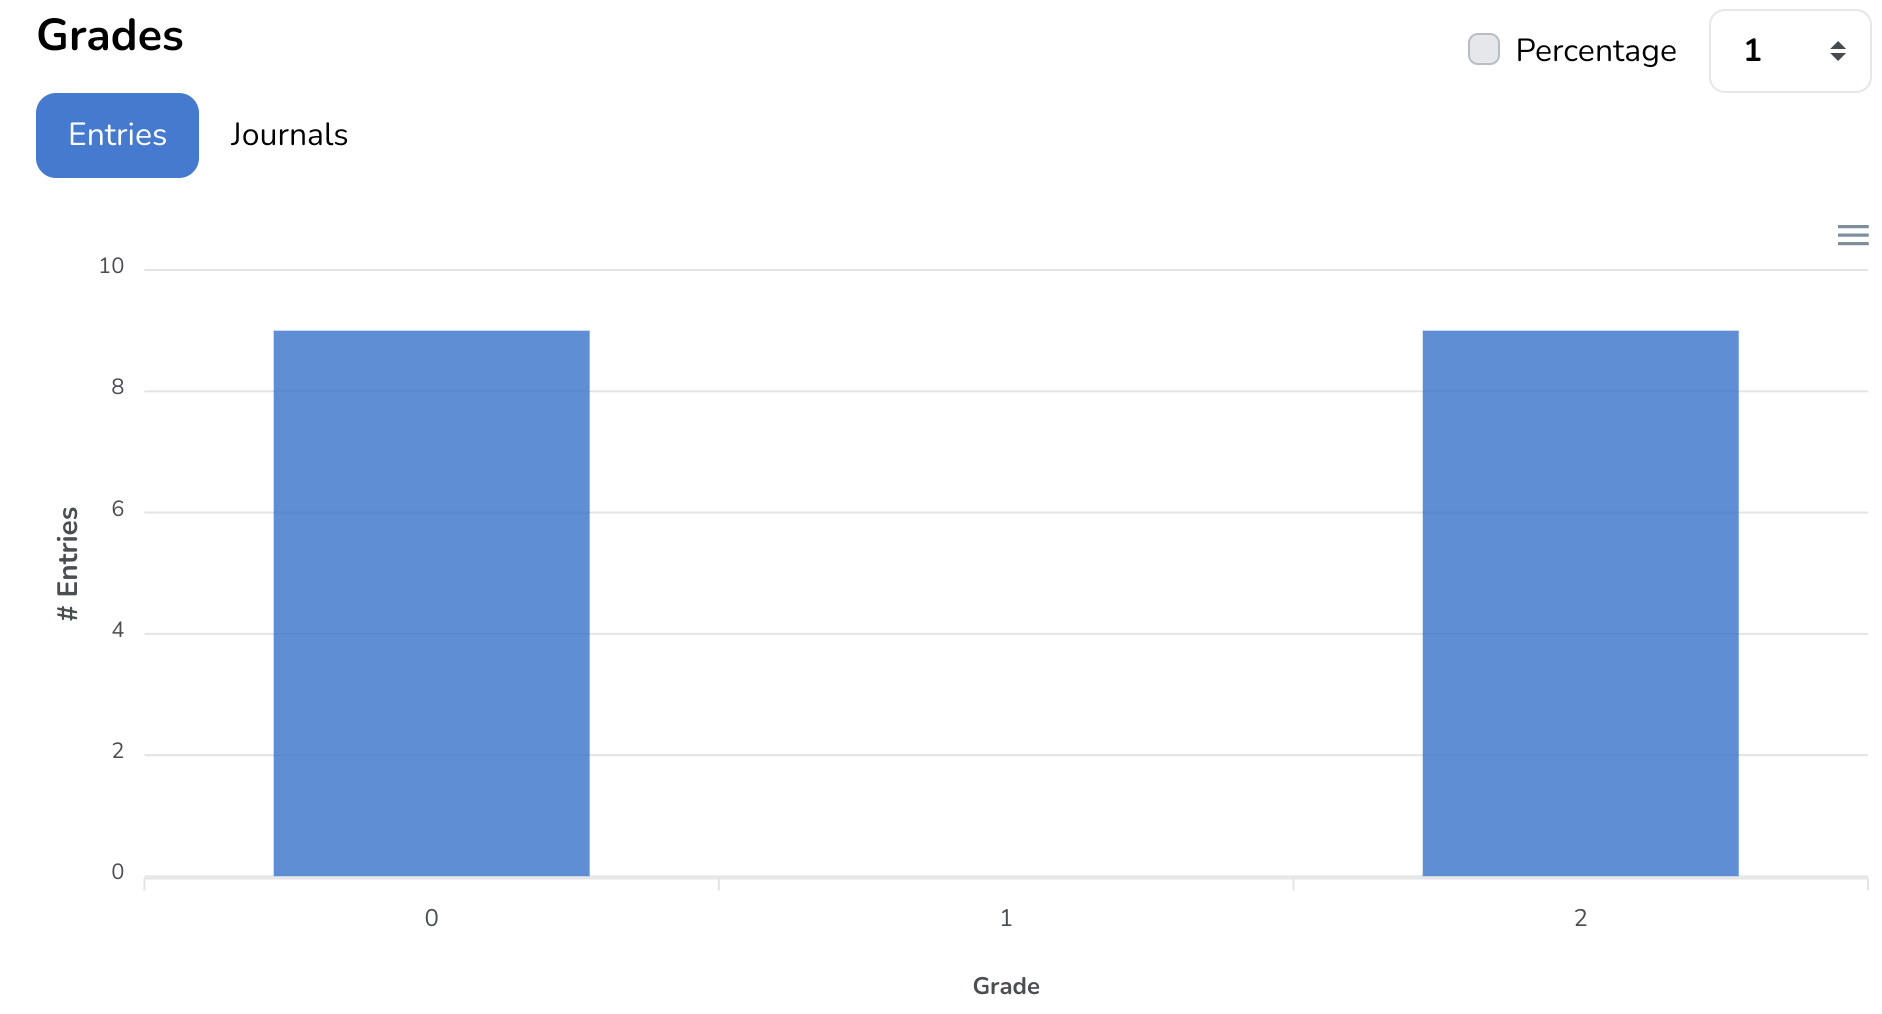

The grades histogram visualizes how many grades fall within a certain grade range. You can change the grade range at the top right of the graph.
It possible to switch between 'Entry' and 'Journal' grades via the respective tab above the graph.
Deadline submissions
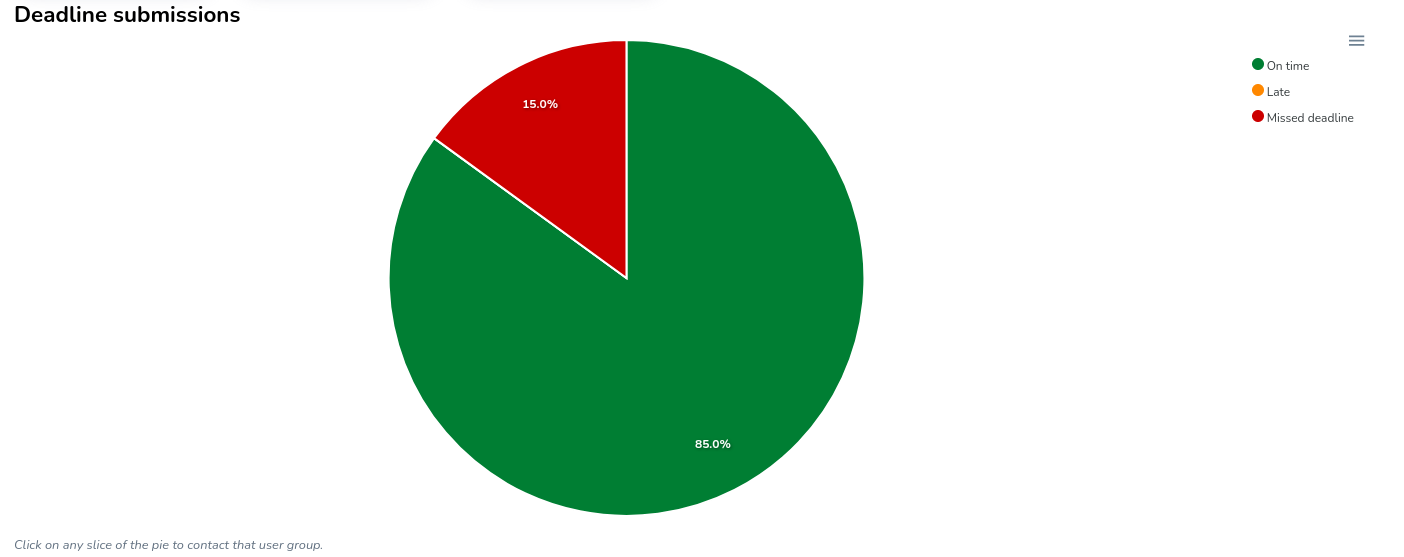
Note
The deadline submissions graph is only visible when a deadline is selected in the timeline.
The deadline submission graph creates a pie chart with a slice for the different submission statuses. By enabling the global filter 'Include Drafts', a new category for drafted (but not submitted) entries will be added to the pie.
Each slice of the pie is interactable. Clicking on a particular slice opens a Journal menu, displaying a list of all journals that are part of that particular submission group.
Communicate with groups of students
After selecting a submission group a Journal menu is opened. You can then choose to filter which journals you would like to contact. Click Contact Users to communicate with all the authors in the current journal selection.